Setup of IAR Development Environment
During the development process, we use the IAR Embedded Workbench IDE environment for code building / downloading / debugging. If you have not installed the IAR Embedded Workbench IDE, please go to the IAR official website to download the trial version.
Know RTL8710BN Demo Board
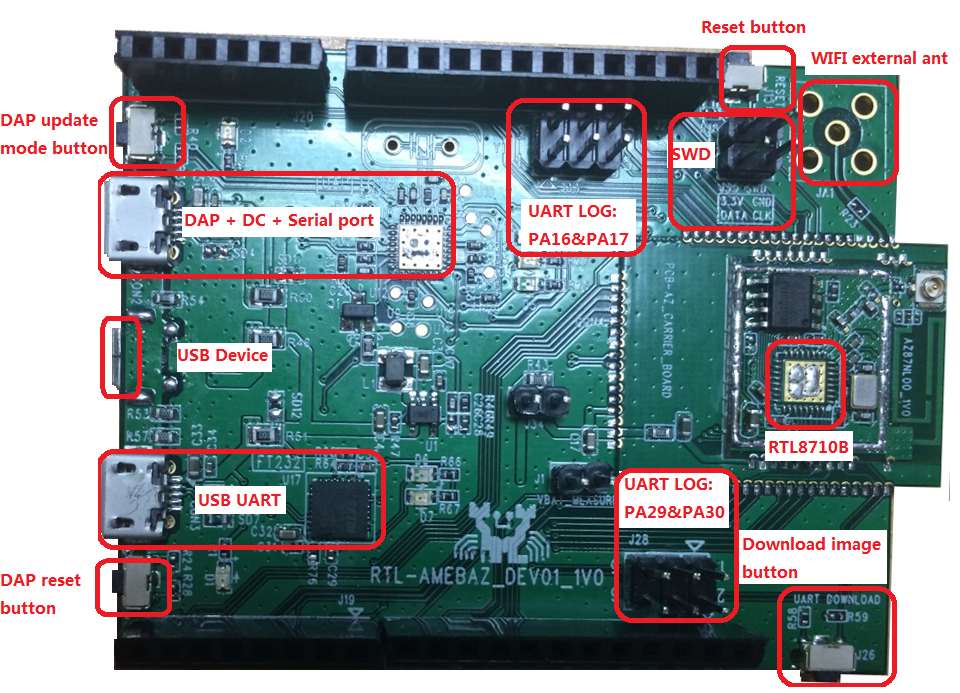
Connect to the board
Demo board integrates FT232, and the USB UART provides 5V power supply as a log serial port.
Step 1:Windows will automatically install the FT232 driver after connecting the board.
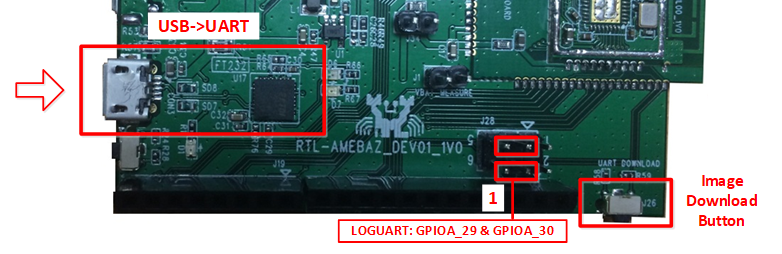
Step 2:Use the jumper to connect the pins in the two red boxes at the “1” position, and connect the USB UART of the development board to the USB port of the computer using a Mini usb cable.
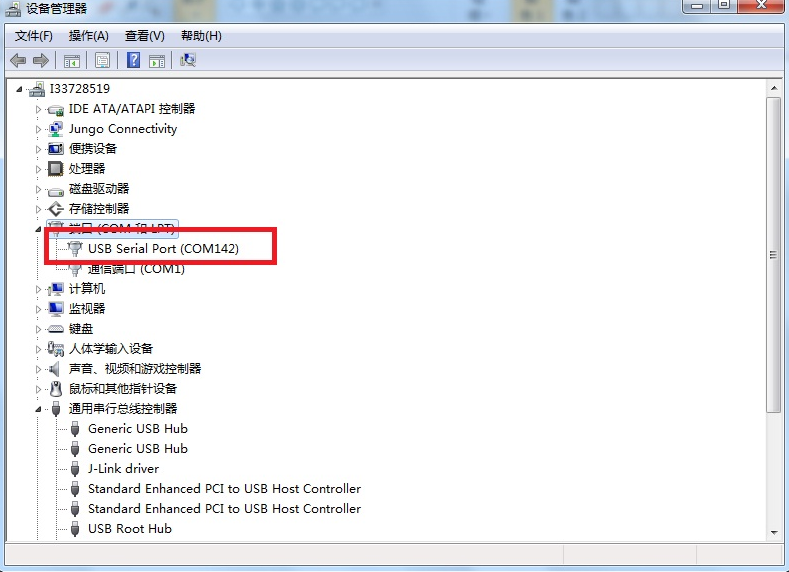
Step 3:In the device management, you can see “USB Serial Port (COMXX)”, use the serial debugging assistant to open the corresponding serial port, and the baud rate defaults to 115200.
Step 4: Install Jlink driver
Step 5:Connect the SWD interface of the board to J-LINK, the correspondence between SWD and JTAG interface:3.3V–VCC, DATA(SWDIO)–TMS, CLK(SWCLK)–TCLK, GND–GND。
Compile the firmware and download it to the board
After connecting the board to your computer, follow the steps below to download the firmware to the development board.
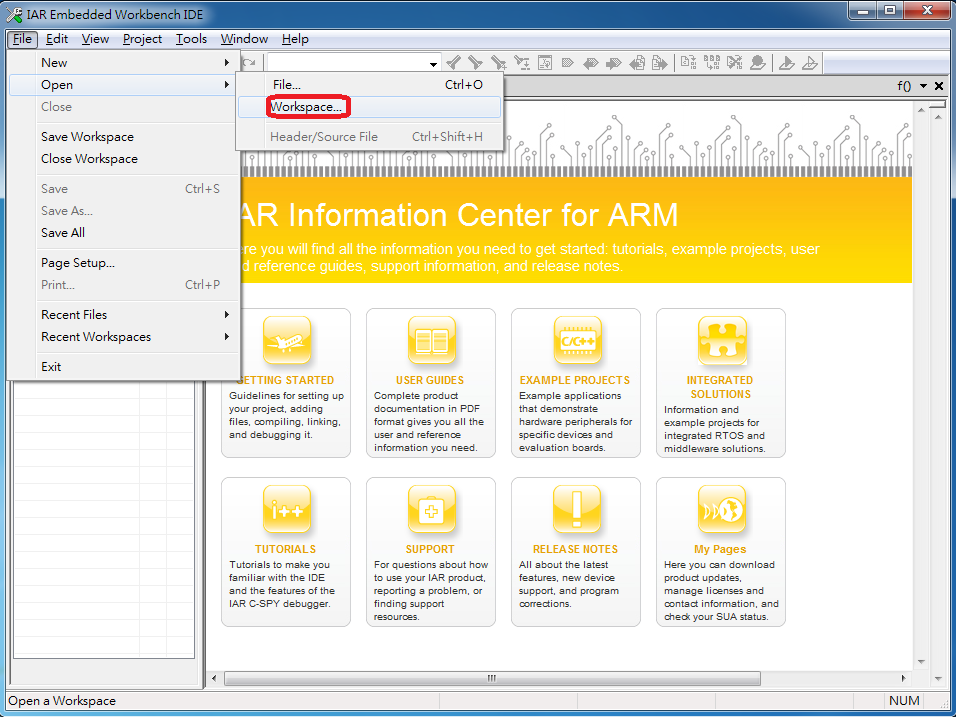
Step 1:Open IAR Embedded Workbench IDE
Step 2:Choose File -> Open -> Workspace
Step 3:Go to Project path project\project_name_xxxx\EWARM-RELEASE and click Project.eww,open Project
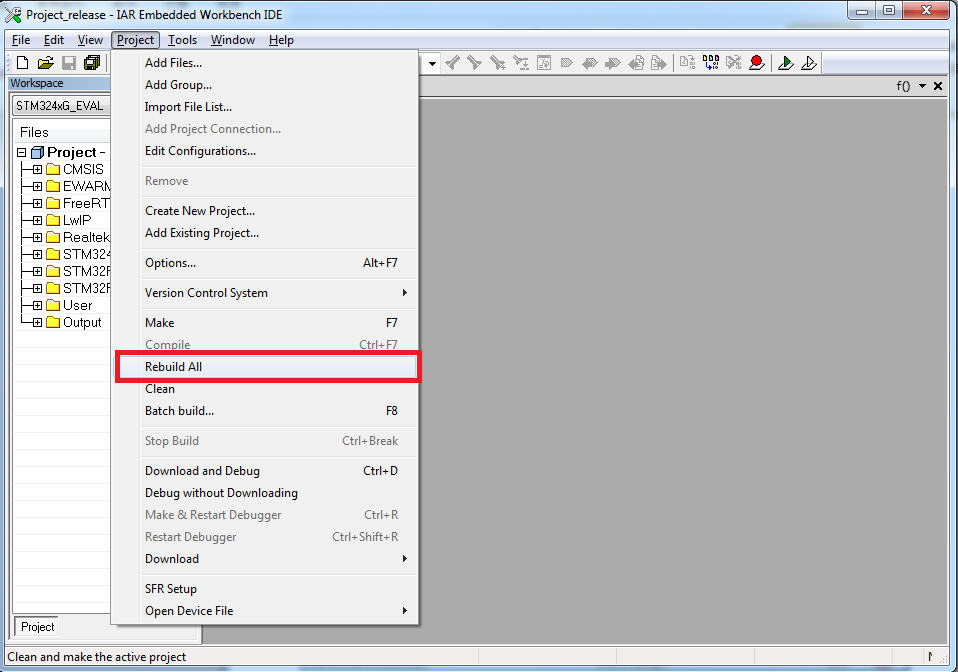
Step 4:Choose Project -> Rebuild All來Build Project
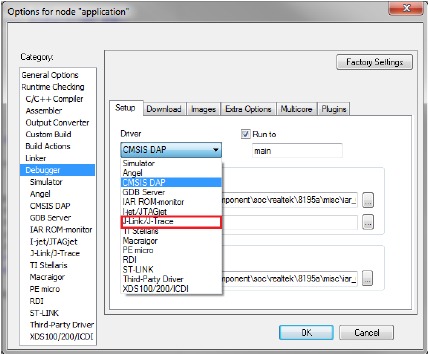
Step5: Confirm that the IAR Project is set to J-Link/J-Trace in the IAR IDE Project -> Option -> Debugger -> Setup -> Driver
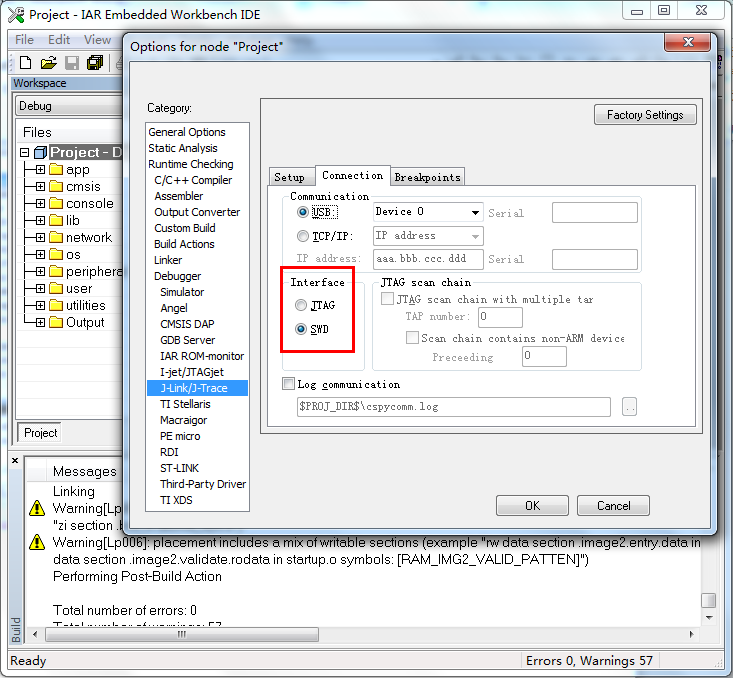
Step 6:Confirm that the Interface in Project -> Option -> J-Link/J-Trace -> Connection in IAR IDE is SWD.
Step 7:After Project Build is successful, please download the firmware to the board by going to Project -> Download -> Download active application.
Step 8: After Download is complete, press the reset button on the development board.
Debug
The following describes how to set up the J-LINK/SWD Debug environment and how to use the IAR IDE to debug.
1) J-LINK/SWD
Step 1:Connect as required above to connect to the development board
Step 2:Connect the SWD interface of the board to J-LINK, the correspondence between SWD and JTAG interface:3.3V–VCC, DATA(SWDIO)–TMS, CLK(SWCLK)–TCLK, GND–GND。
Step 3:Confirm that the IAR Project’s Project -> Option -> Debugger -> Setup -> Driver changes the IAR Project setting to J-Link/J-Trace and confirm with OK.

Step 4:Confirm that the Interface is changed to SWD in the IAR IDE’s Project -> Option -> J-Link/J-Trace -> Connection.

2) Debugging
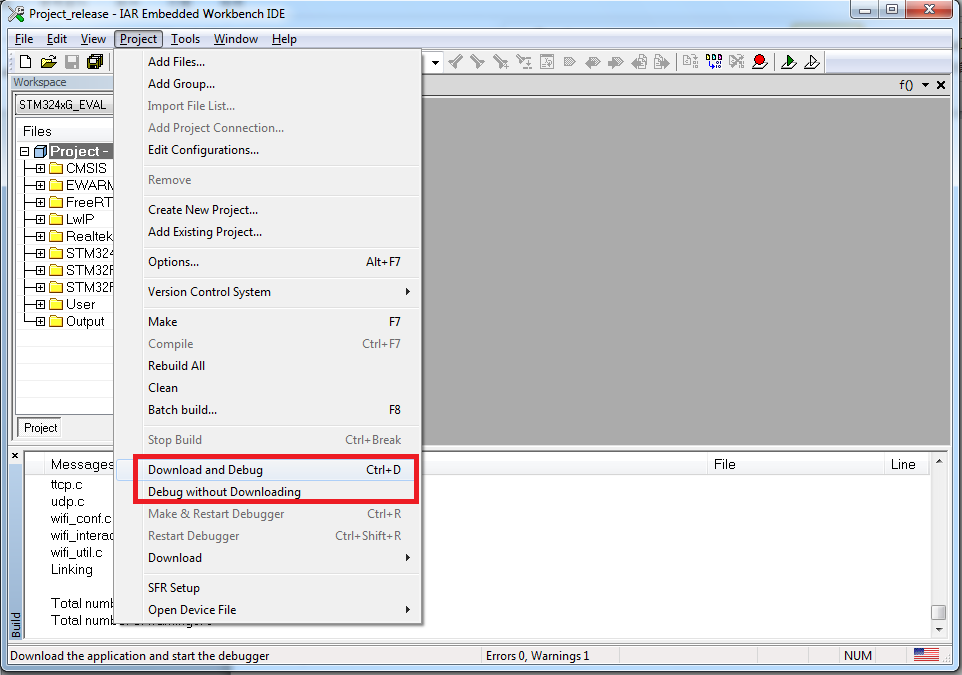
Once the Debug environment is set up, click Project -> Download and Debug / Debug without Downloading.