IAR Development Environment Set up
In development process, we use IAR Embedded Workbench IDE to build code, download code and debugging. If you have not installed IAR IDE, please download the trial version on the IAR official website.
Connect Ameba board to log console
Using #1 Ameba RTL8195 Board
The CMSIS-DAP on Ameba board can be used as the log console and debugger. There are three micro-usb slots on #1 Ameba RTL8195 Board: (1) for debug & load code use (2) for usb connection (3) for power supply. In general case, we use the first micro-usb slot.
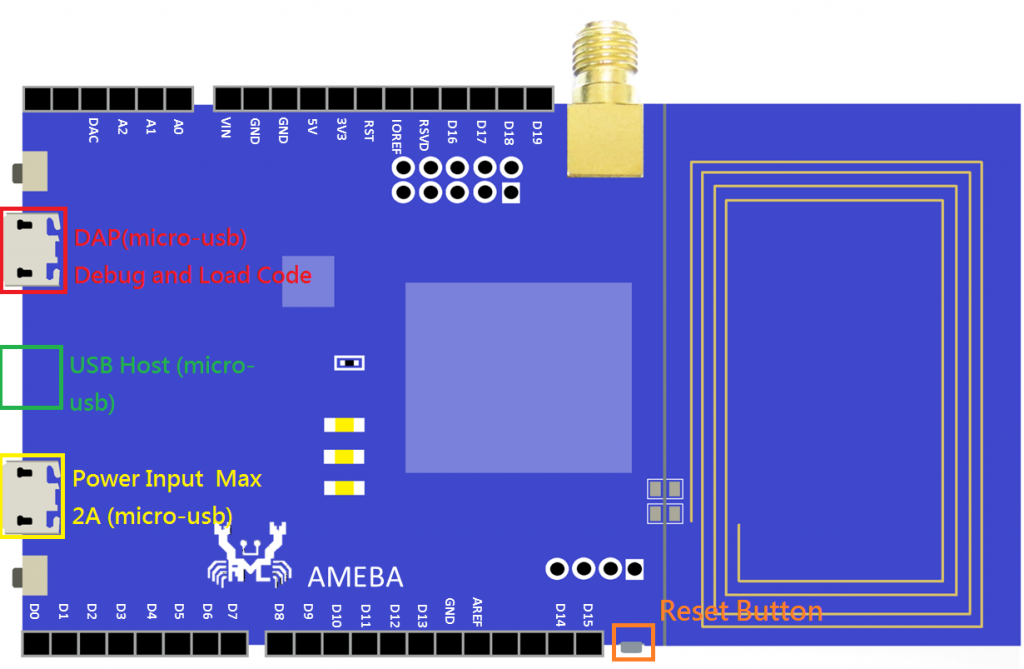
First, please install the “serial to USB driver” (the installation file is provided in tools\serial_to_usb\mbedWinSerial_16466 in the SDK folder.) And connect the “DAP debug and Load Code” port to PC via micro-USB.
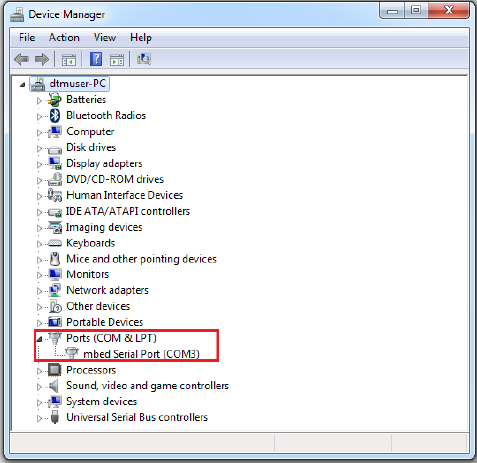
Open device manager, you can find “mbed Serial Port(COMxx)”
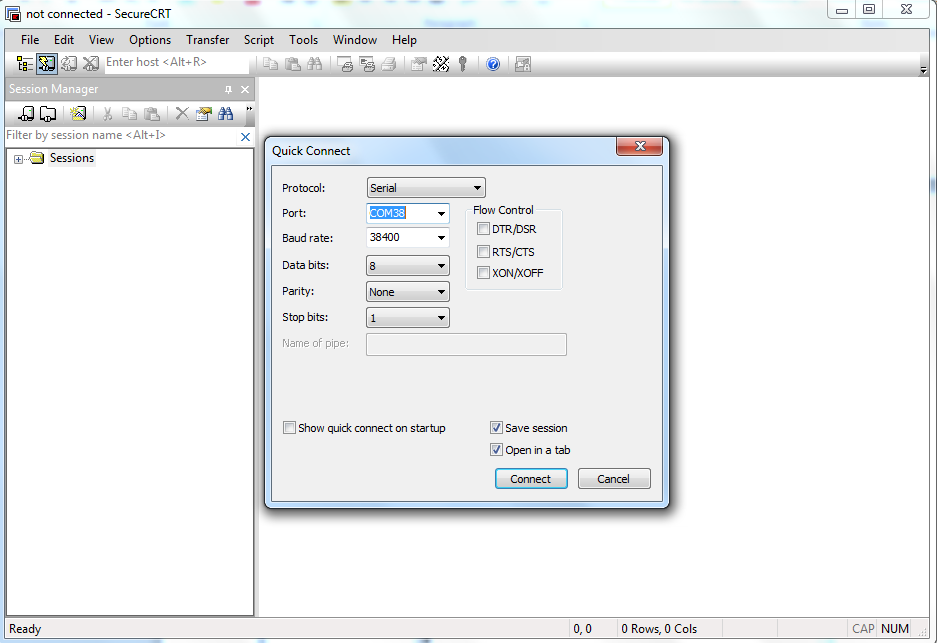
Next, use the terminal tool (e.g., SecureCRT/teraterm/putty) and open the connection port:
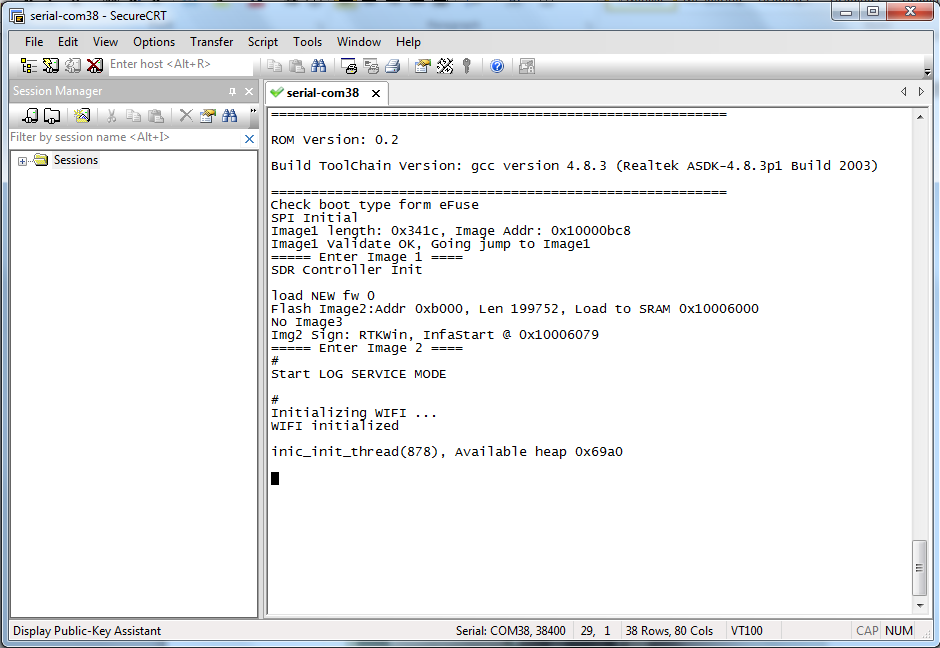
Then press the reset button on Ameba board. You can see some messages in the terminal:
Build Project & Download to Board
Step 1: Open the IAR Embedded Workbench IDE
Step 2: Click File -> Open -> Workspace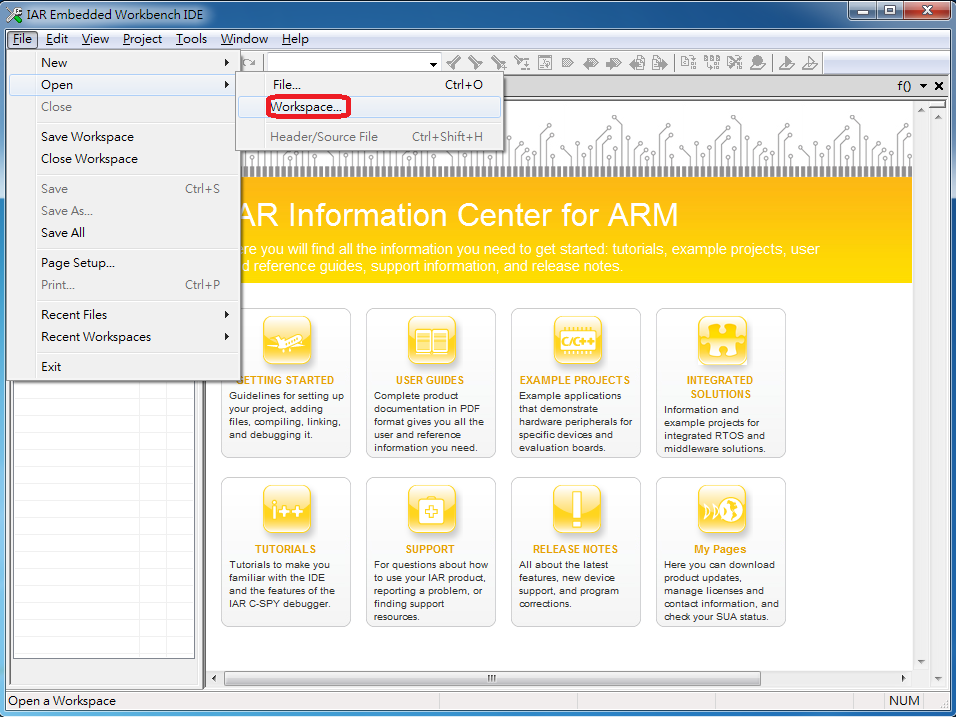
Step 3: Go to the path in the Project folder: project\project_name_xxxx\EWARM-RELEASE, and double-click Project.eww to open the Project
Step 4: Next, click Project -> Rebuild All to build Project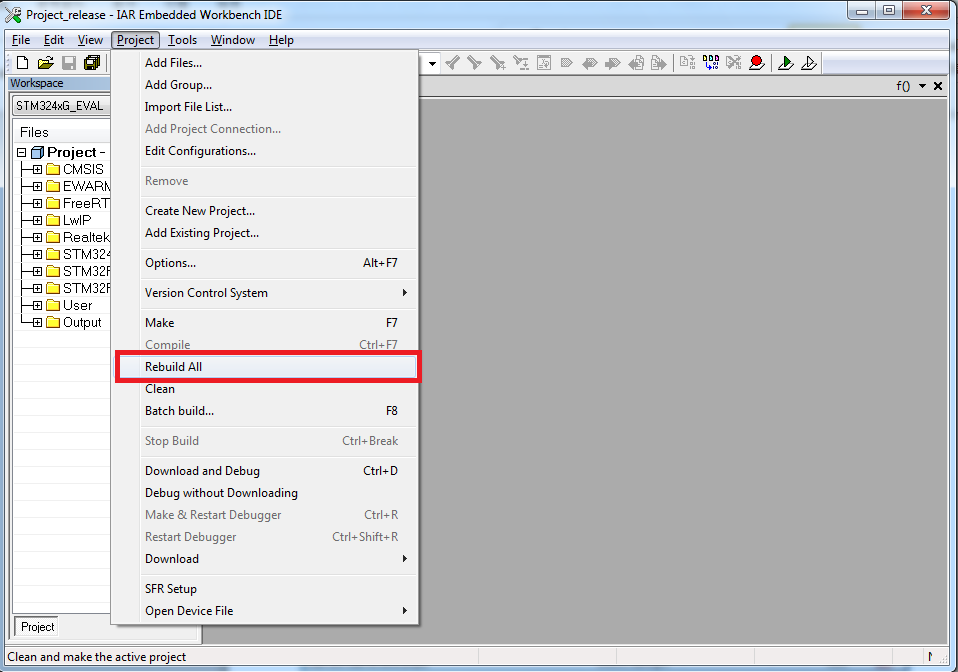
Step 5: If succeed, click Project -> Download -> Download active application to download the code to board
Step 6: After the ownload completes, press the reset button.
Debug
In this section we will elaborate on the debug environment setting of CMSIS-DAP and J-Link/JTAG separately.
Use CMSIS-DAP to debug #1 Ameba RTL8195 Board
After board version 2V0, the CMSIS-DAP debugger is supported. Therefore, just connect the board to PC by a micro USB cable.
Use JTAG to debug #1 Ameba RTL8195 Board
Please weld connection pins on the board for JTAG connection (the upper red-circled part in the figure). For log UART, please weld connection pins to the lower red-circled part in the figure.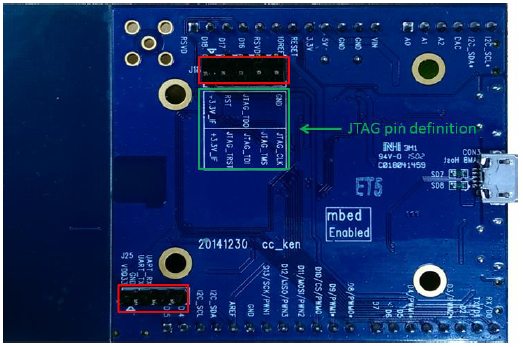
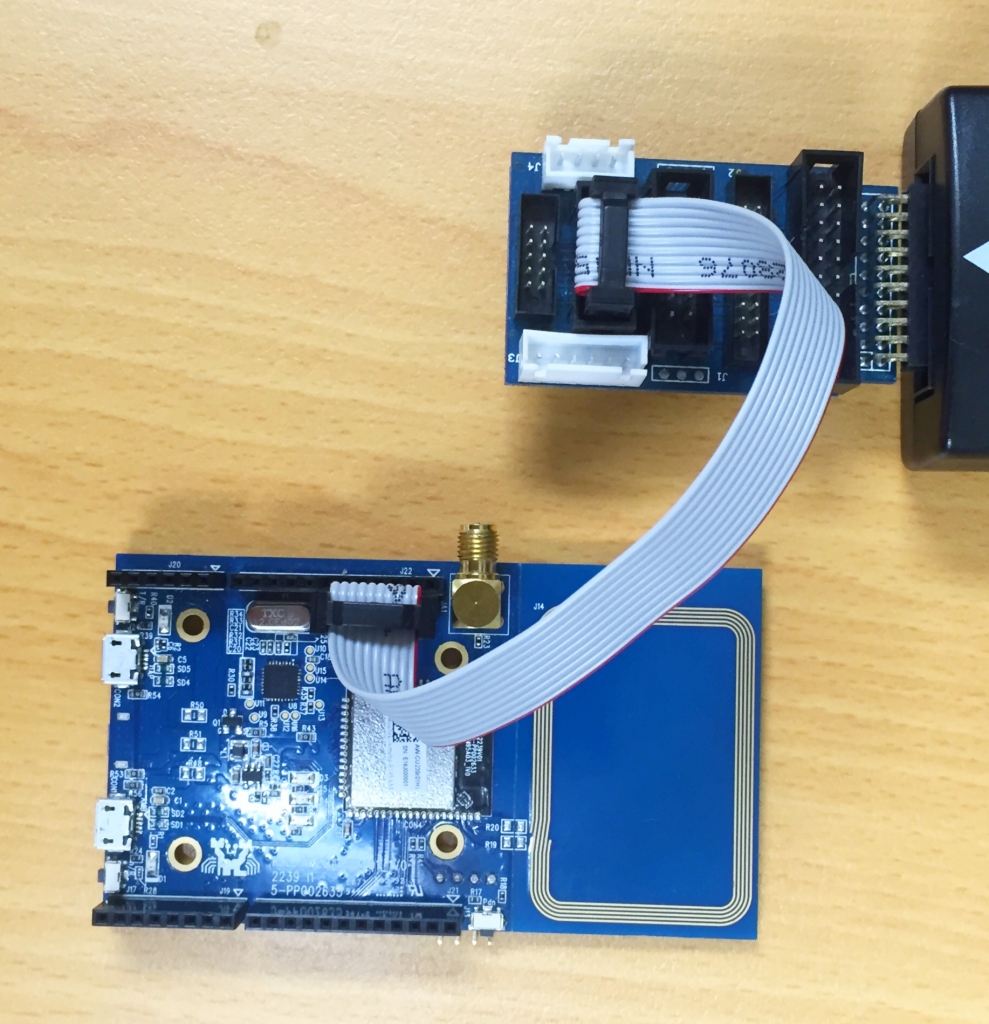
As shown in the figure below, use 2.54mm 2x5pins cable to connect the board and the JTAG adapter, then connect the adapter to J-Link. (Note that normally you can view log message in terminal via “debug & load code use” DAP port. The log UART part is only necessary if you connect PC to the “power supply only” DAP port.)
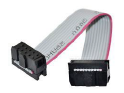
2.54mm 2x5pins Cable
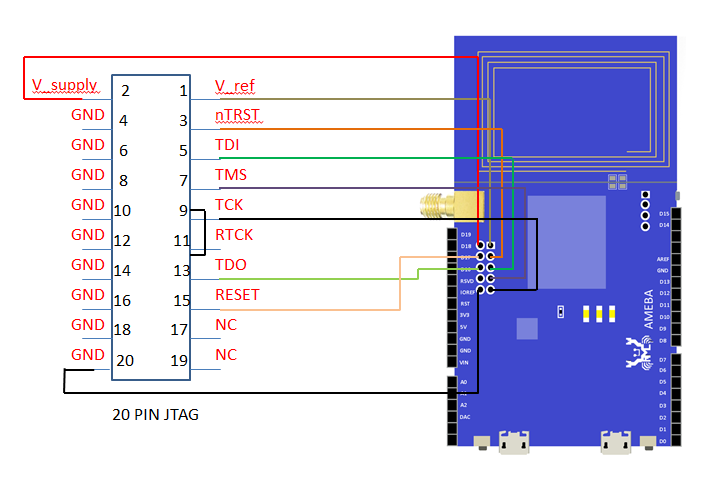
If you don’t have JTAG adapter in hand, you can connect the board to the 20-pin JTAG port as the diagram:
Configure IAR setting to use J-Link/JTAG as debug tool (skip this section if you are using CMSIS-DAP)
First please install J-Link Arm 4.8 driver.
Then use J-Link GDB server to check the JTAG connection. Execute J-Link GDB server, and open the config window, adjust the settings as the figure:
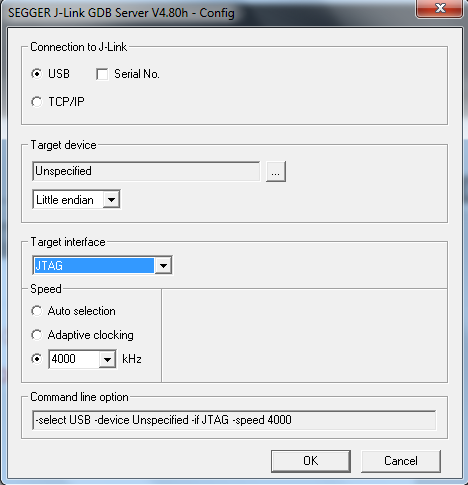
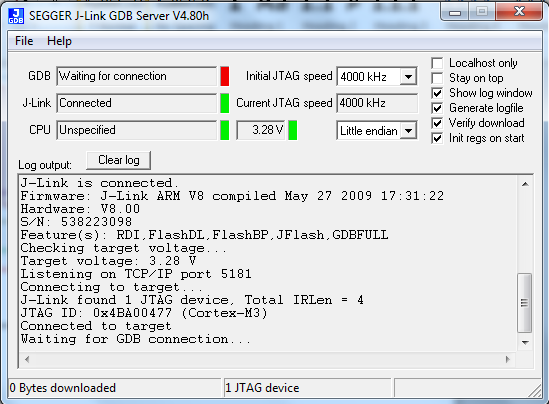
Click “OK”. If you can see the following messages, the JTAG is connected successfully.
In IAR IDE, go to Project -> Options -> Debugger -> Setup -> Driver. Modify the IAR Project setting, set the debugger driver to J-Link/J-Trace, and click OK.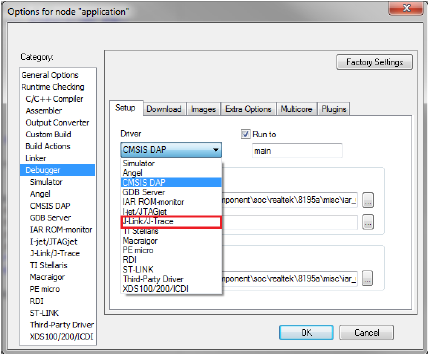
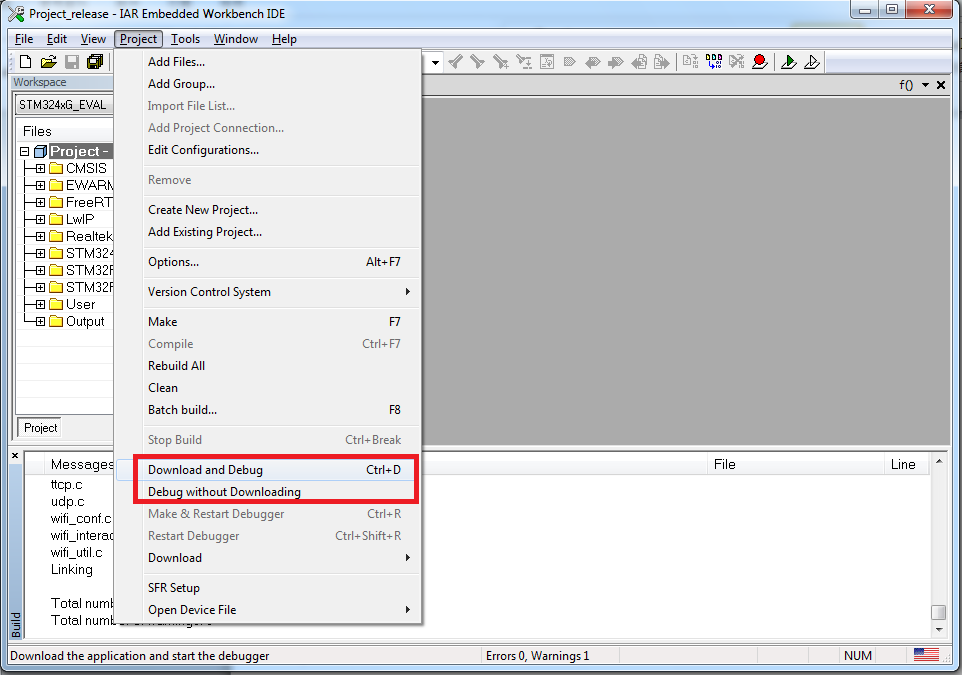
When the debug environment is set, you can use IAR IDE to debug your project step by step. Open the IAR IDE, set breakpoints and click Project -> Download and Debug / Debug without Downloading
Open the terminal tool (e.g., SecureCRT/teraterm/putty), set Buadrate to 38400 to watch the log output.
